
RESEARCH
Cost and cost-effectiveness of PPM-DOTS for tuberculosis control: evidence from India
Coût et rapport coût/efficacité de la stratégie PPM-DOTS dans la lutte contre la tuberculose : résultats obtenus en Inde
Costo y costoeficacia de la DOTS-PP contra la tuberculosis: datos de la India
Katherine FloydI,1; VK AroraII; KJR MurthyIII; Knut LonnrothI; Neeta SinglaII; Y AkbarIII; Matteo ZignolI; Mukund UplekarI
IHIV/AIDS, TB and Malaria, World Health Organization, 1211 Geneva 27, Switzerland
IILRS Institute of Tuberculosis and Allied Diseases, Delhi, India
IIIMahavir Charitable Hospital, Hyderabad, Andhra Pradesh, India
ABSTRACT
OBJECTIVE: To assess the cost and cost-effectiveness of the PublicPrivate Mix DOTS (PPM-DOTS) strategy for tuberculosis (TB) ontrol in India.
METHODS: We collected data on the costs and effects of pilot PPM-DOTS projects in Delhi and Hyderabad using documentary data and interviews. The cost of PPM-DOTS was compared with public sector DOTS (i.e. DOTS delivered through public sector facilities only) and non-DOTS treatment in the private sector. Costs for 2002 in US$ were assessed for the public sector, private practitioners, and patients/attendants. Effectiveness was measured as the number of cases successfully treated.
FINDINGS: The average cost per patient treated was US$ 111123 for PPM-DOTS and public sector DOTS, and US$ 111172 for non-DOTS treatment in the private sector. From the public sector's perspective, the cost per patient treated was lower in PPM-DOTS projects than in public sector DOTS programmes (US$ 2433 versus US$ 63). DOTS implementation in either the public or private sectors improved treatment outcomes and substantially lowered costs incurred by patients and their attendants, compared to non-DOTS treatment in the private sector (US$ 5060 for DOTS compared to over US$ 100 for non-DOTS). The average cost-effectiveness of PPM-DOTS and public sector DOTS was similar, at US$ 120140 per patient successfully treated, compared to US$ 218338 for non-DOTS private sector treatment. Incremental cost-effectiveness analysis showed that PPM-DOTS can improve effectiveness while also lowering costs.
CONCLUSION: PPM-DOTS can be an affordable and cost-effective approach to improving TB control in India, and can substantially lower the economic burden of TB for patients.
RÉSUMÉ
OBJECTIF: Évaluer le coût et le rapport coût/efficacité de la stratégie DOTS mixte, associant secteurs public et privé, dans la lutte contre la tuberculose (TB) en Inde.
MÉTHODES: Des données relatives aux coûts et aux effets de projets pilotes PPM-DOTS menés à Delhi et à Hyderabad ont été rassemblées à partir de l'analyse de documents et d'entretiens. Le coût des projets PPM-DOTS a été comparé à celui de l'application de la stratégie DOTS par le secteur public (c'est-à-dire la délivrance des prestations DOTS par des établissements publics uniquement) et à celui d'un traitement non DOTS mis en uvre par le secteur privé. Les coûts en US $ pour 2002 ont été évalués pour le secteur public, les praticiens privés et les malades/les personnes qui les soignent. L'efficacité a été mesurée par le nombre de cas traités avec succès.
RÉSULTATS: Le coût moyen par malade traité se montait à US $ 111-123 pour la stratégie PPM-DOTS et les prestations de type DOTS par le secteur public et à US $ 111-172 pour le traitement non DOTS pratiqué par le secteur privé. Du point de vue du secteur public, le coût par malade traité était plus faible pour les projets PPM-DOTS que pour les programmes DOTS mis en uvre par le secteur public (US $ 24-33 contre US $ 63). Qu'elle soit appliquée par le secteur public ou privé, la stratégie DOTS permet d'améliorer les résultats thérapeutiques et de réduire considérablement les coûts supportés par les malades et les personnes qui les soignent par comparaison avec le traitement non DOTS appliqué par le secteur privé (US $ 50-60 pour la stratégie DOTS contre plus de US $ 100 pour le traitement non DOTS). Les rapports coût/efficacité moyens pour la stratégie PPM-DOTS et pour la stratégie DOTS appliquée par le secteur public étaient similaires : US $ 120-140 par malade traité avec succès, à comparer à la valeur de US $ 218-338 obtenue pour le traitement non DOTS. Une analyse différentielle du rapport coût/efficacité a montré que la stratégie PPM-DOTS permettait d'améliorer l'efficacité tout en abaissant les coûts.
CONCLUSION: La stratégie PPM-DOTS est une approche peu onéreuse et d'un bon rapport coût/efficacité pour faire progresser la lutte contre la tuberculose en Inde. Elle permet de réduire substantiellement la charge économique qu'impose aux malades cette pathologie.
RESUMEN
OBJETIVO: Evaluar el costo y la costoeficacia de la estrategia DOTS publicoprivada (DOTS-PP) como medio de control de la tuberculosis en la India.
MÉTODOS: Reunimos datos sobre los costos y los efectos de proyectos piloto de DOTS-PP llevados a cabo en Delhi y Hyderabad, utilizando para ello información documental y entrevistas. El costo de la DOTS-PP se comparó con el de la DOTS del sector público (es decir, el tratamiento DOTS aplicado sólo a través de establecimientos del sector público) y el del tratamiento distinto del DOTS en el sector privado. Se evaluaron los costos en US$ correspondientes a 2002 para el sector público, los médicos particulares, y los pacientes/asistentes, y la eficacia se midió como el número de casos tratados satisfactoriamente.
RESULTADOS: El costo medio por paciente tratado fue de US$ 111 - 123 para la DOTS-PP y la DOTS del sector público, y de US$ 111 - 172 para el tratamiento distinto del DOTS administrado en el sector privado. Desde la perspectiva del sector público, en los proyectos DOTS-PP el costo por paciente tratado fue menor que en los programas DOTS del sector público (US$ 24 - 33 frente a US$ 63). Tanto en el sector público como en el privado, la aplicación de la DOTS mejoró los resultados terapéuticos y redujo sustancialmente los costos para los pacientes y sus asistentes en comparación con el tratamiento distinto del DOTS en el sector privado (US$ 50 - 60 para el DOTS, frente a más de US$ 100 en el otro caso). La costoeficacia media del DOTS-PP y el DOTS del sector público fue semejante, de US$ 120 - 140 por paciente tratado satisfactoriamente, frente a US$ 218 - 338 para el tratamiento no DOTS en el sector privado. El análisis de la costoeficacia marginal demostró que el DOTS-PP puede mejorar la eficacia reduciendo al mismo tiempo los costos.
CONCLUSIÓN: El DOTS-PP puede ser una alternativa asequible y costoeficaz para mejorar el control de la tuberculosis en la India, y reducir sustancialmente la carga económica que acarrea la tuberculosis para los pacientes.

Introduction
Globally, there are almost nine million new cases of tuberculosis (TB) each year, two million of which result in death. More than one-third of these cases and deaths are in India and China.1,2
The global targets for TB control established by the World Health Assembly (WHA) are to detect 70% of new smear-positive cases and to successfully treat 85% of all detected cases; the target year was initially 2000, and was later reset to 2005.3,4 More recently, targets to decrease TB prevalence and deaths by 50% by 2015 (compared with 1990) have been set by the Stop TB partnership, within the framework of the Millennium Development Goals.1
From the mid-1990s until 2005, the internationally-recommended strategy for achievement of these TB control targets was DOTS. The DOTS strategy has five components: (i) government commitment to tuberculosis control; (ii) diagnosis by sputum smear microscopy; (iii) standardized short-course chemotherapy using first-line drugs, provided under proper case management conditions including directly observed treatment (DOT); (iv) a regular supply of free drugs; and (v) a recording and reporting system with assessment of treatment outcomes.5 In March 2000, 20 of the 22 high-burden countries that collectively account for 80% of global cases committed to achieving the WHA targets through implementation of the DOTS strategy,6 and DOTS remains the foundation of the new Stop TB Strategy developed by WHO to guide TB control efforts during the period 200615.7 However, while 82% of new smear-positive cases enrolled in DOTS programmes in 2002 were successfully treated, only 45% of estimated new smear-positive cases were detected by DOTS programmes in 2003.1 Implemmenting new strategies that can help to meet the case detection target has become an important global TB control priority.
Health expenditure in the private sector is substantial in high-burden countries.8 Many TB cases are detected and treated in this sector, but are not notified to public authorities and therefore not recorded in official statistics.9 Treatment outcomes are also generally poor in this sector.1013 To increase case detection rates, improve successful treatment rates and reduce out-of-pocket expenditures by patients, it is necessary to involve the private sector in DOTS implementation.
From the late 1990s, WHO has developed a strategy called "PublicPrivate Mix DOTS" (PPM-DOTS), which is based on field projects in diverse settings.9,14 It consists of DOTS implementation in the private sector, with free drugs and financial support provided by the government and strengthened collaboration between public and private providers through improved referral and information systems.
By 2003, pilot projects had shown that PPM-DOTS could improve case detection and treatment outcomes.1520 However, the cost and cost-effectiveness of PPM-DOTS remained unclear. This was an important gap. Cost data are required to facilitate budgeting for PPM-DOTS within national TB control plans. Cost-effectiveness data are needed to allow assessment of whether PPM-DOTS provides value for money, and if results are favourable to assist resource mobillization.
We assessed the cost and cost-effectiveness of two of the first PPM-DOTS projects to be established. Both projects are in India, which accounts for about 20% of TB cases globally. India has a successful public sector DOTS programme implemented by the Revised National Tuberculosis Control Programme (RNTCP)1 and a large private sector.
Methods
Description of pilot projects
The two PPM-DOTS projects we evaluated were located in Hyderabad and Delhi, cities with populations of 5 and 18 million, respectively. Both projects covered one TB unit (TU), the standard planning unit of the RNTCP that is expected to serve 500 000 people.
The project in Hyderabad was started in October 1998, following the signature of a Memorandum of Understanding (MoU) between the RNTCP and Mahavir Charitable Hospital (MCH). MCH is a private not-for-profit institution that was given responsibility for managing PPM-DOTS implementation and for acting as an interface between the public and private sectors. The MoU included provision of a budget to MCH for expenditures on start-up and routine implementation activities, supply of free drugs and laboratory supplies by the RNTCP to MCH for distribution to participating private providers, and reporting of cases detected and treatment outcomes to the RNTCP by MCH according to national guidelines. MCH staff compiled a list of all doctors practising in the TU (n = 332) and visited all of them over a period of three months to familiarize them with the PPM-DOTS project and encourage participation. After this start-up phase, meetings were held every month in each of the six wards of the TU to maintain and improve participation.
The PPM-DOTS project in Delhi was started in January 2001, with contractual arrangements similar to those in Hyderabad except that the MoU was signed between the Delhi Medical Association (DMA) and the RNTCP. As in Hyderabad, the DMA organized orientation of private practitioners, training using standard RNTCP modules, and following the start-up phase met regularly with private providers. The initial focus was on doctors working in five "nursing homes", which function as small hospitals offering both inpatient and outpatient care. This was followed by involvement of doctors who had their own individual clinics.
The main characteristics of the PPM-DOTS projects are summarized in Table 1; detailed descriptions are available elsewhere.15,16
Alternative strategies compared
The evaluation of any project or programme requires comparison with a relevant alternative.21 In Delhi, PPM-DOTS was implemented as a supplemment to existing public sector DOTS services (Table 1). Therefore, we compared PPM-DOTS with a situation in which DOTS is implemented through public sector facilities only. The time period considered was 1 January 2001 to 30 June 2002. We assumed that in the absence of PPM-DOTS, all cases treated in the project would have been treated in the private sector but not under DOTS, i.e. we assumed that the project did not divert cases from the public sector. The available data support this assumption; the number of patients detected by public sector DOTS services increased at a higher rate in the PPM-DOTS area than in a comparable area where PPM-DOTS was not implemented.16,17
In Hyderabad, PPM-DOTS was used to expand DOTS to an area (Mahavir) that had no public sector DOTS services. We therefore made two comparisons. First, we compared PPM-DOTS in Mahavir TU with public sector DOTS in a second TU in Hyderabad, called Osmania. Osmania has a demographic and socioeconomic profile similar to that of Mahavir, but no PPM-DOTS project. Second, we compared PPM-DOTS with diagnosis and treatment entirely in the private sector but not according to the DOTS strategy. Such treatment typically involves non-standardized drug regimens, reliance on X-rays for diagnosis and monitoring, weekly or monthly consultations with doctors, and no DOT or follow-up of treatment outcomes.9 The time period considered was 1 October 1998 to 31 December 2002.
Effectiveness
We used two measures of effectiveness: (i) the number of cases detected (i.e. notified); and (ii) the number of cases successfully treated. These are the standard indicators used by WHO to measure programme performance1 and have been used in many recent cost-effectiveness studies related to TB control.2228 For all strategies involving DOTS, data were compiled from RNTCP reporting forms from the start of DOTS implementation and used to calculate the annual average number of patients detected and successfully treated. For non-DOTS treatment in the private sector, no data were available on treatment outcomes from either study site during the time period we considered. We therefore used data from two studies in India (in Delhi and Mumbai)10,11 and one study in Viet Nam.13 Results from these studies were similar with a mean treatment success rate of 51% (95% confidence interval 4656%, based on a total of 440 patients).
Costs
We assessed costs from the perspective of the public sector, private sector providers, and patients and their attendants, in 2002 US$ (i.e. a societal perspective was adopted). Local costs were converted using the average exchange rate in 2002 (US$ 1 = 48 Indian rupees).
For public sector and private provider costs, the total costs of each strategy component (e.g. orientation and training of private providers, drugs) were calculated separately, using the "ingredients" approach (i.e. quantities of resources used in non-monetary terms were assessed separately from unit prices), and then summed. Resources such as staff time and clinic space that were donated (i.e. provided free of charge) by private providers, but which would have been used for another purpose in the absence of PPM-DOTS (i.e. there was an "opportunity cost"), were treated as costs and valued according to their market price (including any profit component). Examples of market prices used were rental charges and typical consultation fees per visit. Capital costs were annualized using standard methods,21,29 and a discount rate of 3%.29,30 Data sources included expenditure records, laboratory records and staff interviews. To be consistent with the analysis of effectiveness we converted total public sector and private provider costs into an annual average cost.
For all strategies except non-DOTS treatment in the private sector in Hyderabad, we estimated patient and attendant costs using a structured questionnaire that was administered to a random sample of 50 patients for each strategy. Patients were asked about monetary expenditures on drugs, laboratory tests and other investigations, consultations with private practitioners, and transport, and also about the time taken to access services. Time costs were valued according to the reported average wage.29 For non-DOTS treatment in the private sector in Hyderabad, we used the results from a survey that collected data for the same cost items from a sample of 204 patients in 1997 (before the introduction of PPM-DOTS),12 with values inflated to year 2002 values using gross domestic product (GDP) deflator data.
Cost-effectiveness
Given the uncertainty about treatment outcomes in the non-DOTS private sector, and observed variability in patient/attendant costs, cost-effectiveness was estimated using a multivariate uncertainty analysis (run in @RISK: version 4.5, Palisade, Newfield, NY). We specified a normal distribution with mean 51% and standard deviation 2.4% for treatment outcomes in the private non-DOTS sector, based on the data for 440 patients mentioned previously, and normal distributions for patient/attendant costs based on data reported here. The outputs of interest in the analysis were total costs, total incremental costs, total effects, total incremental effects, and two cost-effectiveness indicators: (i) the average cost per patient successfully treated; and (ii) the incremental cost per patient successfully treated associated with implementation of PPM-DOTS. Means and lower and upper bounds (5th and 95th centiles) for all outputs were based on a Monte Carlo simulation involving 5000 iterations.31
Results
In both Delhi and Hyderabad, higher numbers of cases were notified and successfully treated when PPM-DOTS was implemented, including new smear-positive cases (Table 2). The successful treatment rate was close to or exceeded the WHO target of 85%. The PPM-DOTS project in Hyderabad successfully treated 40% and 85% more cases than public sector DOTS and non-DOTS treatment in the private sector, respectively. In Delhi, the PPM-DOTS project increased the number of patients successfully treated by 69% compared to non-DOTS treatment in the private sector. The corresponding figures for new smear-positive cases were 83%, 88% and 65%, respectively.
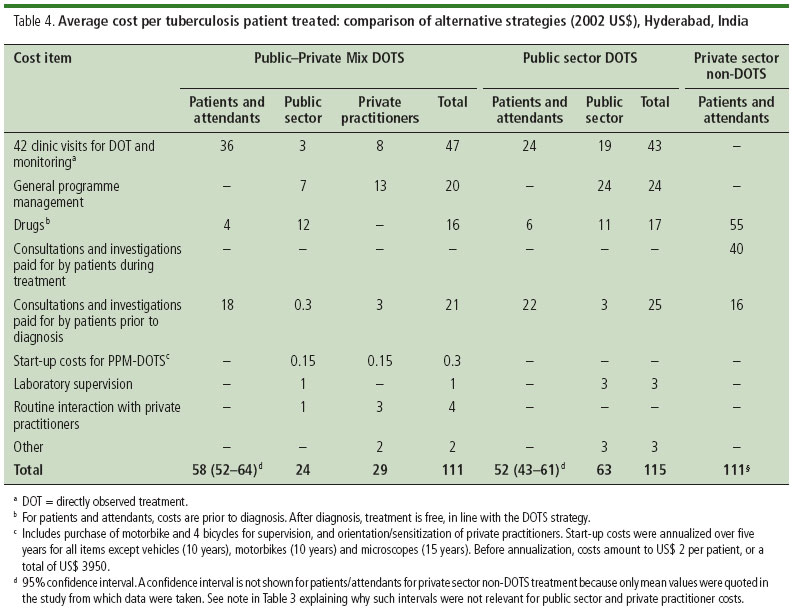
The average cost per patient treated was similar for PPM-DOTS in Delhi and Hyderabad, and public sector DOTS in Hyderabad, at between US$ 111 and US$ 123 (Table 3 and Table 4). The largest costs were for clinic visits for DOT and monitoring, general programme management, and drugs (about 70% of total costs in each site). Start-up costs were relatively small. Public sector costs were lower in PPM-DOTS projects (US$ 2433 per patient treated compared with US$ 63 per patient treated for public sector DOTS). This reflected the large contribution made by private providers (valued at US$ 3040 per patient) principally clinic space and staff time for DOT and project management that was provided at no charge. Costs incurred by patients/attendants were consistently about US$ 5060 when DOTS was implemented. For non-DOTS treatment in the private sector, mean costs ranged from US$ 111 in Hyderabad to US$ 172 in Delhi, all of which was borne by patients and their attendants. The main reason for higher total costs compared with DOTS was higher expenditure on drugs.
The cost-effectiveness of the two PPM-DOTS projects and the public sector DOTS programme in Hyderabad was similar, with an average societal cost per patient successfully treated of between US$ 118 and US$ 144 (Fig. 1, Table 5). Non-DOTS treatment in the private sector was much less cost-effective, at US$ 218 per patient successfully treated in Hyderabad and US$ 338 per patient successfully treated in Delhi. This reflected lower effectiveness (both sites) and, in Delhi, larger costs (mostly due to higher drug prices). When considering public sector costs only, PPM-DOTS was much more cost-effective than public sector DOTS (US$ 2539 versus US$ 79 per patient successfully treated).

The incremental cost per patient successfully treated associated with PPM-DOTS depended on the costing perspective chosen (Table 5). From a societal perspective, PPM-DOTS in Delhi reduced costs and increased effectiveness, thus giving a negative cost per additional patient successfully treated. PPM-DOTS in Hyderabad did not increase total costs but improved effectiveness when compared to non-DOTS treatment in the private sector. From the perspective of the public sector, PPM-DOTS in Hyderabad was lower cost and more effective than public sector DOTS in the comparison area of Osmania.
Discussion
Globally, the PPM-DOTS projects in Hyderabad and Delhi are the first to have been evaluated from an economic perspective. Our results show that PPM-DOTS can be affordable and cost-effective when compared to public sector DOTS services, and much more affordable and cost-effective than non-DOTS treatment in the private sector. From the perspective of the public sector specifically, PPM-DOTS projects had lower costs and were more cost-effective than the existing public sector DOTS services. For patients and their attendants, PPM-DOTS was substantially lower cost than non-DOTS treatment in the private sector, with the reduction in cost large in relation to reported monthly incomes averaging about US$ 40. The average cost and cost-effectiveness figures for both public sector DOTS and PPM-DOTS are low by international standards.1,2528
Our analyses had two major limitations. The most important was that evidence about successful treatment rates in the private non-DOTS sector is scarce. Nonetheless, we based our assumptions on available studies,10,11,13 and the multivariate uncertainty analysis allowed results to reflect a plausible range of values. The second limitation was that we had no data on the costs and effects of implementing public sector DOTS in Mahavir, the TU in Hyderabad where PPM-DOTS was implemented. We assumed that costs and treatment outcomes associated with public sector DOTS were adequately reflected by Osmania, an area with a similar demographic and socioeconomic profile. It is reassuring that the costs and treatment outcomes observed in Osmania are similar to those achieved nationally, suggesting that it is typical of public sector DOTS in other parts of India.1
Our results on costs incurred by patients and their attendants during treatment in the private non-DOTS sector are consistent with those from other studies in India, which suggest costs of US$ 100180 per patient treated (in 2002 US$).3235 The cost to the public sector of providing DOTS is consistent with a recent national estimate of US$ 66 per patient treated.1 The cost of time provided free-of-charge by private providers was based on consultation fees, which were similar in both projects and may be typical of other urban areas in India.
While the total cost per patient may be generalizable, the value of resources supplied by private practitioners at no charge to patients and with no reimbursement from the public sector was large in both PPM-DOTS projects (US$ 3040 per patient). This raises questions about sustainability. The Mahavir project has been functioning for ten years and the PPM-DOTS project in Delhi has functioned successfully after the 18-month pilot phase that we evaluated. Many private practitioners view participation in PPM-DOTS as a good investment that improves the reputation of their clinic, and PPM-DOTS may also be sustainable because TB patients account for a very small share of private practitioners' clients. Nevertheless, more research is needed to improve our understanding of the incentive structure of private practitioners and how this affects decisions to become and stay involved in PPM-DOTS.
If the PPM-DOTS projects of Hyderabad and Delhi are to be emulated elsewhere in India, it is essential to replicate the factors that have contributed to their success. A recent analysis suggested that PPM-DOTS needs four components to be effective: (i) improved referral and information systems linking the public and private sectors; (ii) training and sensitization of private practitioners as well as national TB programme staff; (iii) supervision and monitoring of private practitioners by the government sector; and (iv) a free supply of drugs from the public sector to private practitioners, which are then given free of charge to patients.36 Guidelines on implementing PPM approaches in the context of TB control, based on the positive experiences from the projects described here as well as more than 40 PPM-DOTS projects worldwide, are now available.37
The project in Hyderabad is replicable where public sector DOTS services are non-existent or insufficient to cover the existing population, for example cities that have experienced rapid population growth. The Delhi project is replicable where public sector DOTS is already available but many patients are still treated in the private sector. It is difficult, if not impossible, to generalize beyond India, and economic evaluations of PPM-DOTS projects in other countries are needed to assess the extent to which the results from India apply elsewhere.
One interpretation of our results could be that all DOTS implementation should shift towards PPM-DOTS mode, given that costs from the perspective of the public sector were lower than the RNTCP operating through the public sector only. This interpretation would be incorrect for four reasons. First, the results apply to a situation in which PPM-DOTS implementation is building on a public sector programme with strong management and monitoring capacity. Second, convincing the private sector to become involved in DOTS implementation may require a strong public sector programme that has demonstrated success to be in place. Third, if the level of resources supplied free-of-charge by the private sector is not sustainable, the public sector costs of PPM-DOTS and public sector DOTS would be similar. Fourth, PPM-DOTS implementation is at a very early stage. Our data do show, however, that public financing/private provision models can work well.
Conclusion
Overall, our results show that PPM-DOTS can be affordable and cost-effective, and that it reaches patients that the public sector does not. They also provide strong support for the existing policy of scaling up PPM-DOTS in India and, together with the findings from more than 40 PPM-DOTS projects worldwide, for including implementation of PPM approaches as one of the core elements of the WHO's new Stop TB strategy. With expansion of PPM-DOTS in India now under way in 14 cities covering a population of 30 million, it will be important to evaluate its achievements when implemented on this much larger scale. 
Acknowledgements
We thank Dr Khalid, Mr Anup and Mr Desh Raj (Delhi), and Amina Habib, the State TB control officer and Balarum Babu (Hyderabad), for their assistance with data collection and analysis. Thanks are due to the private practitioners who were interviewed during the evaluation in both cities. We also thank Mr Deepak Gupta, Joint Secretary for Health in India, for initiating the PPM-DOTS project in Delhi and for providing suppport for the evaluation of PPM-DOTS projects.
Funding: Some of the staff and travel costs of WHO authors were covered by a grant from USAID. USAID was not involved in the conduct of the study or in the preparation of the paper.
Competing interests: none declared.
References
1. World Health Organization. WHO Report 2005. Global tuberculosis control surveillance, planning, financing. WHO document WHO/HTM/TB/2005.349. Geneva: WHO; 2005.
2. Corbett EL, Watt CJ, Walker N, Maher D, Williams BG, Raviglione MC, et al. The growing burden of tuberculosis: global trends and interactions with the HIV epidemic. Arch Intern Med 2003;163:1009-21.
3. Tuberculosis control programme. Resolution WHA44.8. of the Forty-fourth World Health Assembly. In: Handbook of resolutions and decisions of the World Health Assembly and the Executive Board. Volume III, 3rd edition (19851992). Geneva: WHO; 1993. WHO document WHA44/1991/REC/1.
4. Stop Tuberculosis Initiative. Report by the Director-General to the Fiftythird World Health Assembly. Geneva: World Health Organization; 2000. Unpublished document A53/5.
5. World Health Organization. An expanded DOTS framework for effective tuberculosis control. WHO document WHO/CDS/TB/2002.297. Geneva: WHO; 2002.
6. Amsterdam Declaration to Stop TB. Available from: http://www.stoptb.org/stop_tb_initiative/amsterdam_conference/default.asp
7. Raviglione M, Uplekar M. WHO's new Stop TB strategy. Lancet 2006. 367:952-5.
8. World Health Organization. World health report 2002: Reducing risks, promoting healthy life. Geneva: WHO; 2002.
9. Uplekar M, Pathania V, Raviglione M. Private practitioners and public health: weak links in tuberculosis control. Lancet 2001;358:912-6.
10. L.R.S. Institute. Operations research to assess needs and perspectives of TB patients and providers of tuberculosis care in Nehru Nagar and Moti Nagar chest clinic areas of Delhi. New Delhi: L.R.S. Institute of TB and Allied Diseases; 1998.
11. Uplekar M, Juvekar S, Morankar S, Rangan S, Nunn P. Tuberculosis patients and practitioners in private clinics in India. Int J Tuberc Lung Dis 1998;2:324-9.
12. Administrative Staff College of India. OR study on Role of Private Sector in TB care in Andhra Pradesh, India. Hyderabad; 1998.
13. Lönnroth K, Thuong LM, Lambregts K, Quy HT, Diwan VK. Private tuberculosis care provision associated with poor treatment outcome a comparative study of a semi-private lung clinic and the national tuberculosis control programme in two urban districts in Ho Chi Minh City, Vietnam. Int J Tuberc Lung Dis 2003;7:165-71.
14. World Health Organization. First Meeting of the PublicPrivate Mix Subgroup for DOTS Expansion. WHO document WHO/CDS/TB/2003.317. Geneva: WHO; 2003.
15. Murthy KJR, Frieden TR, Yazdani A, Hreshikesh P. Public-private partnership in tuberculosis control: experience in Hyderabad, India. Int J Tuberc Lung Dis 2001; 5:354-9.
16. Arora VK, Sarin R, Lönnroth K. Feasibility and effectiveness of a public-private mix project for improved TB control in Delhi, India. Int J Tuberc Lung Dis 2003;7:1131-8.
17. Arora VK, Lönnroth K, Sarin R. Improving case detection of tuberculosis through a public-private partnership. Indian J Chest Dis Allied Sci 2004;46:133-6.
18. Quy HT, Lan NT, Lönnroth K , Buu TN, Dieu TTN, Hai LT. Public-private mix for improved TB control in Ho Chi Minh City, Vietnam: an assessment of impact on case detection. Int J Tuberc Lung Dis 2003;7:464-71.
19. Quy HT, Lönnroth K, Lan NTN, Buu TN. Treatment results among tuberculosis patients treated by private lung specialists involved in a public-private mix project in Vietnam. Int J Tuberc Lung Dis 2003;7:1139-46.
20. Newell JN, Pande SB, Baral C, Bam DS, Malla P. Control of tuberculosis in an urban setting in Nepal: public-private partnership. Bull World Health Organ 2004;82:92-8.
21. Drummond MF, O'Brien B, Stoddart GL, Torrance GW. Methods for the economic evaluation of health care programmes. 2nd ed. Oxford and New York: Oxford University Press; 1997.
22. World Health Organization. Guidelines for cost and cost-effectiveness analysis of tuberculosis control. Geneva: WHO; 2002. WHO document WHO/CDS/TB/2002.305a-c.
23. Floyd K, Wilkinson D, Gilks C. Comparison of cost effectiveness of directly observed treatment (DOT) and conventionally delivered treatment for tuberculosis: experience from rural South Africa. BMJ 1997;315:1407-11.
24. Floyd K. Costs and effectiveness the impact of economic studies on TB control. Tuberculosis (Edinb) 2003;83:187-200.
25. Khan MA, Walley JD, Witter SN, Imran A, Safdar N. Costs and cost-effectiveness of different DOT strategies for the treatment of tuberculosis in Pakistan. Health Policy Plan 2002;17:178-86.
26. Floyd K, Skeva J, Nyirenda T, Gausi F, Salaniponi F. Cost and cost-effectiveness of increased community and primary care facility involvement in tuberculosis care in Lilongwe District, Malawi. Int J Tuberc Lung Dis 2003;7:S29-37.
27. Nganda B, Wang'ombe J, Floyd K, Kangangi J. Cost and cost-effectiveness of increased community and primary care facility involvement in tuberculosis care in Machakos District, Kenya. Int J Tuberc Lung Dis 2003;7:S14-20.
28. Okello D, Floyd K, Adatu F, Odeke R, Gargioni G. Cost and cost-effectiveness of community-based care in rural Uganda. Int J Tuberc Lung Dis 2003;7:S72-79.
29. Gold MR, Siegel JE, Russell LB, Weinstein MC, editors. Cost-effectiveness in health and medicine. New York: Oxford University Press; 1996.
30. Russell LB, Gold MR, Siegel JE, Daniels N, Weinstein MC. The role of cost-effectiveness analysis in health and medicine. JAMA 1996;276:1172-9.
31. Hammersley JM, Handscomb DC. Monte Carlo Methods. London: Methuen; 1964.
32. Rajeswari R, Balasubramanian R, Muniyandi M, Geetharamani S, Thresa X, Venkatesan P. Socio-economic impact of tuberculosis on patients and family in India. Int J Tuberc Lung Dis 1999;3:869-77.
33. National Sample Survey Organization. Morbidity and utilisation of medical services. 42nd round, July 1986June 1987. Report No. 364, Department of Statistics, New Delhi: Government of India; 1987.
34. Uplekar M, Juvekar S, Morankar S. Tuberculosis patients and practitioners in private clinics. Bombay: The Foundation for Research in Community Health; 1996.
35. Uplekar M, Rangan S. Tackling TB: the search for solutions. Bombay: The Foundation for Research in Community Health; 1996.
36. Lönnroth K, Uplekar M, Arora VK, Juvekar S, Lan NTN, Mvaniki D, et al. Publicprivate mix for DOTS implementation: what makes it work? Bull World Health Organ 2004;82:580-6.
37. World Health Organization. Engaging all health care providers to improve access, equity and quality of TB care guidance on implementing public-private mix for DOTS. WHO document WHO/HTM/TB/2006.360. Geneva: WHO; 2006.
(Submitted: 18 May 2005 Final revised version received: 5 December 2005 Accepted: 21 December 2005)
1 Correspondence to Dr Floyd (email: floydk@who.int).